U.S. PUBLIC SECTOR PAYMENTS REPORT
A closer look at changing consumer preferences and the opportunities for new payment methods.
1 / 20
INTRO
Consumer preferences regarding government payment methods are evolving. But by how much? This is the question we asked ourselves. Knowing the results would benefit many public sector services, we conducted a comprehensive study.
As always, data brings a unique perspective. If you’re a government entity paying or getting paid by the American people—we suggest you have a read.
2 / 20
METHODOLOGY
Find out by clicking the tabs above the panel.
What?
When?
Where?
- Online study of 1,200 US adults 18 and older
- Americans who have made some form of government payment within the last 12 months
- Age, gender, ethnicity, and region quotas were used to match census distributions for US adult population
- Study was fielded October 19
to November 1, 2021
- Conducted by independent research firm,
Sard Verbinnen & CO
3 / 20
4 / 20
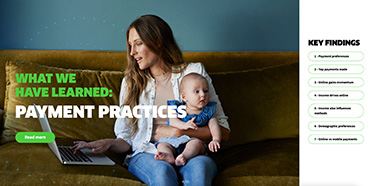
Payment Practices
PAYMENT PREFERENCES
Consumers like variety for paying taxes, but prefer credit and debit cards for other payments
For taxes, 4 payment types are neck and neck in their popularity.
Taxes
Payments other than taxes
Cash
Check
Bank transfer / ACH
Credit card
Debit card / prepaid card
Mobile wallet / digital wallet
Don’t know / no preference
5 / 20
Payment Practices
TOP PAYMENTS MADE
Most consumers make 5 or more payments
Males—and people with higher income make more types of payments
Take a guess at what the top 5 payment categories are, and tap to reveal.
76%
Motor vehicle license & registration fees
75%
Postage, stamps, and other services from the post office
67%
Federal income taxes
63%
State or local income taxes
55%
Property/real estate/school taxes
6 / 20
Payment Practices
ONLINE GAINS MOMENTUM
65% of consumers prefer to make payments online, compared to 26% for mail
Even fewer people prefer options such as in-person or mobile payments
Click below to learn if this is attached to
any consumer concerns
Online security is still a concern, but it’s more trusted than mail payments
Participants were more concerned about a payment getting lost in the mail

7 / 20
Payment Practices
INCOME DRIVES ONLINE
Online preference increases with income
While preference for
in-person and mail decrease
Online*
In person
Mobile
Telephone
<$35K
$35K - $75K
$75K +
<$35K
$35K - $75K
$75K +
<$35K
$35K - $75K
$75K +
<$35K
$35K - $75K
$75K +
<$35K
$35K - $75K
$75K +
*using a desktop or laptop computer

8 / 20
Payment Practices
INCOME RELATED
When income increases, preference for ACH and credit increases
Preference for cash, debit and mobile decrease
How wide is the gap?
Find out by clicking on the tabs below.
For tax payments
For payments other than taxes
Bank transfer / ACH
Credit card
<$35K
$35K - $75K
$75K +
Bank transfer / ACH
Credit card
<$35K
$35K - $75K
$75K +

9 / 20
Payment Practices
DEMOGRAPHIC PREFERENCES
Younger generations are more likely than older to prefer mobile and in-person
Click the tabs to view the breakout from Gen Z to Boomers.

Online*
In person
Mobile
Telephone
Gen Z
Gen Y
Gen X
Boomers
Gen Z
Gen Y
Gen X
Boomers
Gen Z
Gen Y
Gen X
Boomers
Gen Z
Gen Y
Gen X
Boomers
Gen Z
Gen Y
Gen X
Boomers
*using a desktop or
laptop computer
10 / 20
12 / 20
Disbursement Practices
DISBURSEMENT PREFERENCES
Over three quarters received government disbursements in one year
Direct deposit is the most common disbursement method and the most preferred
How closely consumers’ preferred payment methods align with available payment methods
Check
Direct Deposit/ACH
Prepaid Card/Electronic Benefit Transfer (EBT) Card
Mobile Wallet/Digital Wallet
Current
Preferred
13 / 20
Disbursement Practices
GENDER FINDINGS
Men are more likely than women to prefer checks
Slightly less likely to prefer ACH
Preference to receive payments from the government by gender
Check
Direct Deposit/ACH
Prepaid Card/Electronic Benefit Transfer (EBT) Card
Mobile Wallet/Digital Wallet
Male
Female
14 / 20
Disbursement Practices
INCOME INFLUENCES
PAYMENT METHOD CHOSEN
ACH increases with income while other options decrease
Preference to receive payments from the government by income
Check
Direct Deposit/ACH
Prepaid Card/Electronic Benefit Transfer (EBT) Card
Mobile Wallet/Digital Wallet
<$35K
$35K - $75K
$75K +
15 / 20
Disbursement Practices
DEMOGRAPHIC PREFERENCES
Older consumers more likely than younger to prefer ACH
And less likely to prefer other options
Preference to receive payments from the government by generation
Check
Direct Deposit/ACH
Prepaid Card/Electronic Benefit Transfer (EBT) Card
Mobile Wallet/Digital Wallet
Gen Z
Gen Y
Gen X
Boomers
16 / 20
KEY TAKEAWAYS
56% of consumers have a positive experience with government payments
Most consumers feel government payment methods have become more flexible—but there is room for improvement
Consumers trust online and ACH for making government payments
Online is superior to mail— especially for paying taxes. As online becomes more trusted universally, more consumers file electronically for its:
 Convenience
 Fast Acknowledgement
 Security
 Faster Refunds
18 / 20
MORE ABOUT FIS
With more than 15 years of experience, Worldpay from FIS has helped government agencies at the federal, state, and local levels upgrade their payment options to meet the needs of their constituents.
In addition to delivering on consumers’ preference —shown in this report—our integrated payment processing solutions can help you gain new efficiencies in payments and disbursements while minimizing risk.
Working with one trusted payment provider, like FIS, will make the steps toward greater digitizing, not a road less traveled but a road marked for success. Join the 1M+ merchants who use our services.
Visit us here.
19 / 20
©2022 FIS and/or its subsidiaries. FIS®, Worldpay®, and any associated brand names/logos are the trademarks of FIS and/or its affiliates. All other trademarks are the property of their respective owners. This content is for information purposes only. We have taken care in the preparation of this information but will not be responsible for any loss or damage including loss of profits, indirect, special or consequential loss arising as a result of any information in this document or reliance on it. The content of this material may not be reproduced without prior consent of Worldpay. This material may include information on third parties and their services. The reference to these third parties is for information purposes only and does not constitute an endorsement or recommendation of the third party or their service.

20 / 20


